The Altman Z-Score compresses several financial-statement ratios into one distress indicator. That simplicity is useful for screening a long list of companies. It is also the source of the model’s biggest risk: a precise-looking number can conceal the wrong formula, stale accounts or missing evidence about cash and debt.
The original model was developed for publicly traded manufacturers. Private manufacturers, non-manufacturing businesses and financial institutions do not fit the same assumptions. Before calculating anything, identify the legal entity, industry, listing status, accounting scope and reporting date. Then select a model whose inputs can be supported.
This guide explains the original Altman Z-Score formula, the private-company Z-prime variant and the four-variable Z-double-prime model. A worked example shows how each component affects the result. The final sections turn the score into a diligence workflow rather than a mechanical pass-or-fail label.
What to establish before using the score
Match the model. Public manufacturers, private manufacturers and non-manufacturers do not use the same formula.
Verify the perimeter. Every input must refer to the same legal entity or consolidated group and compatible reporting periods.
Read the components. A stable zone can conceal a material deterioration in earnings, liquidity or leverage.
Keep it as a screen. Add cash flow, debt maturities, filing age and subsequent events before making a credit or supplier decision.
What the Altman Z-Score measures—and what it does not
The model combines several dimensions of a company’s financial position. Working capital relative to total assets represents short-term balance-sheet liquidity. Retained earnings relative to total assets reflects accumulated profitability and, indirectly, maturity. EBIT relative to total assets measures operating performance generated by the asset base. Equity relative to liabilities captures leverage. The original and Z-prime models also include sales relative to assets as an activity measure.
Each ratio is multiplied by a coefficient and the contributions are added. The result is not a percentage. It is not a credit rating, probability of default, legal insolvency finding or forecast of the exact date a company will fail. It is a classification score derived from a particular model and reference population.
That distinction matters for enterprise decisions. A procurement team may need to know whether a supplier can deliver through the next contract cycle. A lender may focus on debt service and covenant headroom. An acquisition team may care about sustainable earnings and the funding required after completion. The Z-Score can prioritise which companies deserve attention, but it cannot answer those questions alone.
Choose between three Altman Z-Score formulas
Original Z-Score for listed manufacturers
In the original formula, X1 is working capital divided by total assets; X2 is retained earnings divided by total assets; X3 is EBIT divided by total assets; X4 is market value of equity divided by total liabilities; and X5 is sales divided by total assets. All balance-sheet inputs should refer to the same reporting date, while income-statement inputs should cover the matching period.
The traditional interpretation places a score below 1.81 in the distress zone, from 1.81 to 2.99 in the grey zone and above 2.99 in the safe zone. These labels belong to this formula. Applying them to another variant is a category error.
Z-prime for private manufacturers
The Z-prime variant replaces market value of equity with book value of equity and changes the coefficients. Traditional zones are below 1.23 for distress, 1.23 to 2.90 for grey and above 2.90 for safe. Book equity must be taken from the same entity and date as the liabilities. Do not substitute an estimate from a different group company.
Z-double-prime for non-manufacturers
The Z-double-prime model removes sales to reduce sensitivity to industry differences in asset turnover. X4 uses book value of equity divided by total liabilities. Traditional zones are below 1.10 for distress, 1.10 to 2.60 for grey and above 2.60 for safe.
| Model | Typical company | Equity input | Sales variable | Traditional zones |
|---|---|---|---|---|
| Original Z | Public manufacturer | Market value | Included | <1.81 / 1.81–2.99 / >2.99 |
| Z-prime | Private manufacturer | Book value | Included | <1.23 / 1.23–2.90 / >2.90 |
| Z-double-prime | Private or public non-manufacturer | Book value | Excluded | <1.10 / 1.10–2.60 / >2.60 |
These are model conventions, not universal regulatory thresholds. Banks, insurers and other financial institutions require sector-specific capital and liquidity measures. A company can also sit outside the population for which any of these formulas is suitable. When the match is weak, report that limitation instead of forcing a score.
The correct formula depends on the company.
Listed manufacturer
Original five-variable Z model. Uses market value of equity and includes sales.
Private manufacturer
Z-prime variant. Uses book value of equity and revised coefficients.
Operating company
Z-double-prime is often used. It removes the sales-to-assets variable.
Bank or insurer
Use sector-specific capital and liquidity analysis, not an industrial-company formula.
Worked private-company example
Consider a private manufacturer with $100 million of total assets. Current assets are $45 million and current liabilities are $30 million, so working capital is $15 million and X1 is 0.15. Retained earnings of $25 million make X2 equal to 0.25. EBIT of $8 million makes X3 equal to 0.08.
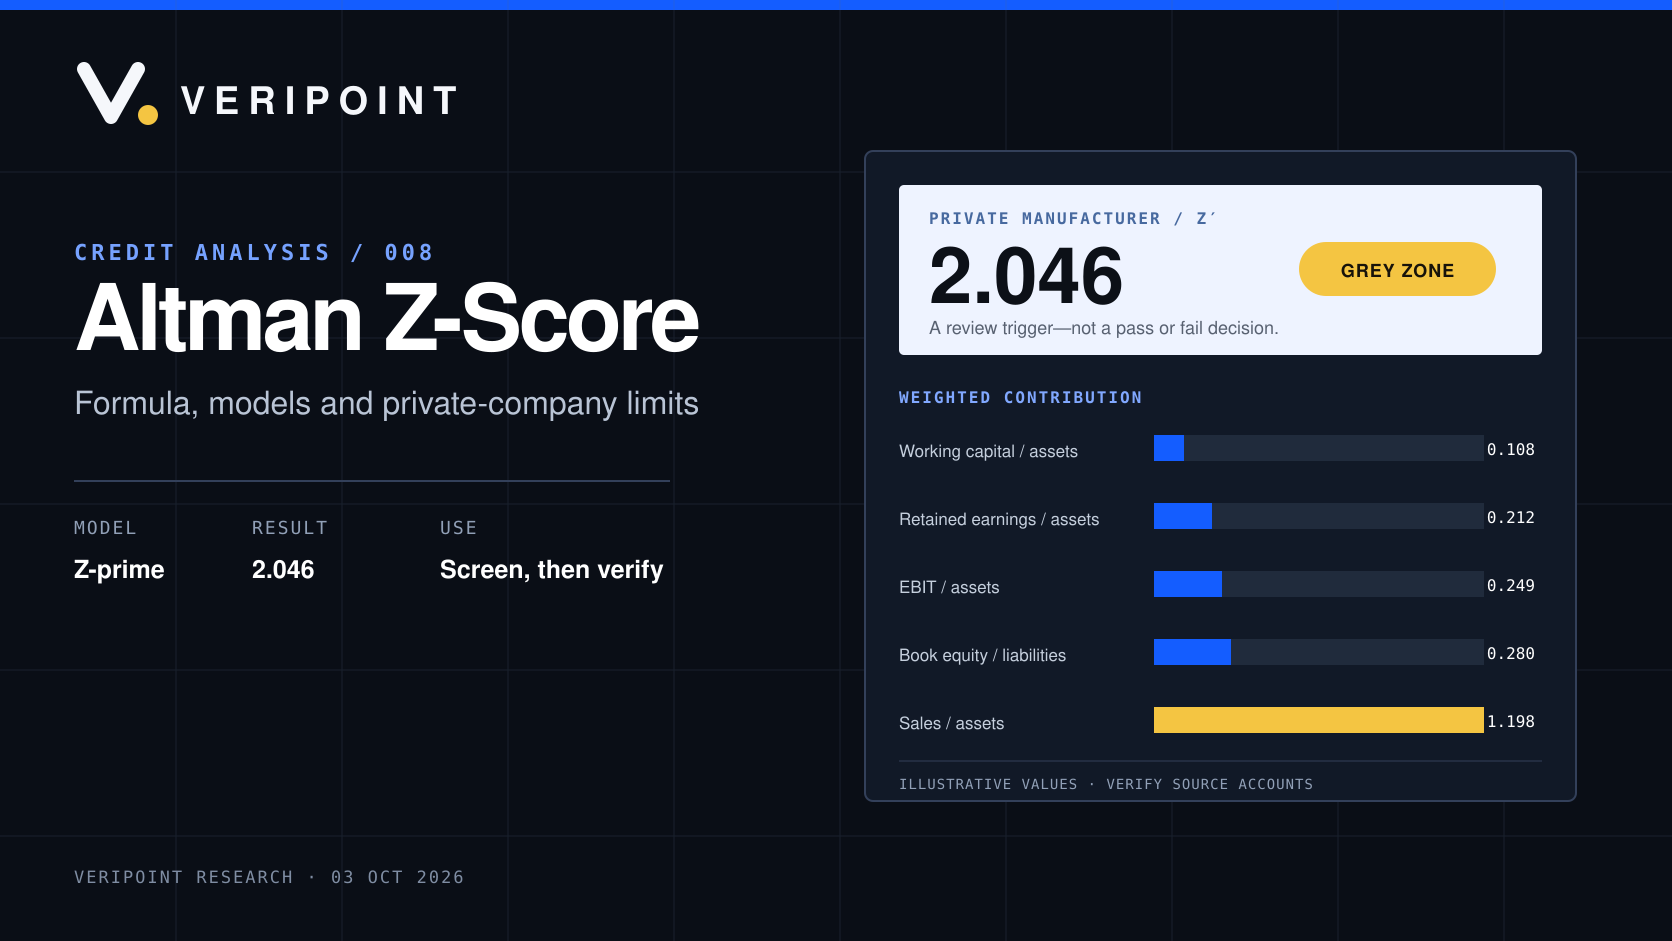
Book equity is $40 million and total liabilities are $60 million, producing X4 of 0.667. Sales are $120 million, so X5 is 1.20. Using Z-prime, the five weighted contributions are 0.108, 0.212, 0.249, 0.280 and 1.198. The total score is 2.046.
Under the traditional Z-prime cut-offs, 2.046 is in the grey zone. That is not a medium probability of failure and does not mean the company is safe for a particular contract. It means this screening model does not place the company in either outer zone.
One strong component can dominate the total score.
The chart exposes an important feature: sales to assets contributes almost 59% of the total. A business with high asset turnover can therefore receive substantial support from X5 even while profitability or working capital weakens. The result is mathematically correct under the chosen model, but a decision-maker still needs to understand the composition.
Recalculate the score using exact filed values, consistent units and the correct sign. Working capital is current assets minus current liabilities, not cash. EBIT should not silently become EBITDA. Total liabilities should include the liabilities shown within the relevant reporting perimeter. If the company has restated prior periods, use the restated comparative and preserve the earlier filing as evidence of the change.
Interpret the score as a trend and a set of causes
A single result can be distorted by the reporting date. Seasonal inventory, customer receipts and year-end supplier payments may change working capital materially. Market value can move sharply without an immediate change in filed accounts. A multi-year series provides more information: calculate the same model from the same source hierarchy for at least three periods where the data allows.
Do not look only for a zone change. In the illustrative company, increasing EBIT from 2% to 14% of total assets raises Z-prime from 1.86 to 2.23. Every result remains in the grey zone, even though operating performance changes sevenfold. A dashboard that shows only “grey” would discard the more important signal.
A large margin change may leave the classification unchanged.
Decompose every year into its weighted components. A falling score caused by a temporary inventory build is different from one caused by accumulated losses and negative book equity. A rising score driven by a liability restructuring is different from sustained operating cash generation. The contribution bridge tells the reviewer which documents to request next.
For a listed company, distinguish changes in X4 caused by market capitalisation from changes in liabilities. A share-price fall can lower the original Z-Score even before the next financial statements are filed. That may be informative, but it combines market sentiment with accounting data measured on different dates. Record the price date and share count used.
Where the Altman Z-Score can fail
The wrong model creates false precision
Using the original public-manufacturer formula for a private services company is not a harmless shortcut. Market value may be unavailable, asset turnover differs by sector and the original coefficients were calibrated for another population. State the model name and formula in the output so another analyst can reproduce the choice.
Filed accounts can be stale
Private-company accounts may describe a period that ended many months before the decision. Since then, the company may have refinanced, lost a customer, paid a dividend, made an acquisition or entered a restructuring process. Capture the period end, filing date and retrieval date separately. Search for subsequent filings and obtain current management information when exposure is material.
Accounting policies affect the inputs
Capitalised development, leases, revenue recognition, provisions and consolidation scope can change the ratios without a matching change in immediate cash risk. Compare accounting policies across periods and peers. Do not mix consolidated sales with standalone assets or a parent’s equity with a subsidiary’s liabilities.
The model omits direct cash-flow evidence
Working capital is a balance-sheet amount, not a cash forecast. The classical formulas do not directly include operating cash flow, capital expenditure, interest payments, scheduled debt principal or covenant headroom. A company can have a reasonable Z-Score and still face a near-term payment problem. Pair the result with cash conversion analysis, debt maturity information and a liquidity forecast.
Zone labels can become decision rules
“Safe” is especially dangerous when copied into supplier onboarding or credit approval. The label means only that the score sits above a historical cut-off for the selected model. It does not verify bank details, ownership, sanctions exposure, legal status, contract concentration or operational dependency. Build escalation rules around evidence and exposure, not colour alone.
Extreme values and small denominators distort the result
Very small or negative total assets, negative equity and unusual liability structures can create unstable ratios. A recent reorganisation may make retained earnings difficult to compare. When an input produces an economically nonsensical result, show the raw values and decline to classify rather than clipping the ratio invisibly.
A decision-useful evidence workflow
Start with entity resolution. Confirm the legal name, registration number, jurisdiction and reporting perimeter. Similar company names and group structures can lead to a score calculated from the wrong accounts. Preserve the source filing and its timestamp.
- Define the decision. State whether the review supports supplier onboarding, credit, investment, acquisition or monitoring, and record the financial exposure and time horizon.
- Select and document the model. Record listing status, industry, formula, coefficients, cut-offs and the reason the variant is appropriate.
- Map the accounts. Tie current assets, current liabilities, retained earnings, EBIT, equity, liabilities, sales and total assets to exact statement lines and periods.
- Calculate the contribution bridge. Keep each ratio and weighted contribution visible. Do not publish only the final score.
- Run a trend and sensitivity test. Recalculate comparable years and test material uncertain inputs rather than treating one number as fixed.
- Add missing risk evidence. Review cash flow, interest coverage, debt maturities, overdue balances, covenant information and subsequent events.
- Set the action. Decide whether to proceed, request evidence, reduce exposure, monitor more frequently or escalate to specialist review. Document the rationale separately from the score.
Monitoring should focus on the facts that can change the decision: new accounts, insolvency filings, charges, ownership changes, auditor qualifications and material deterioration in financial ratios. Recalculating the score without updating the evidence creates the appearance of monitoring without the substance.
| Observed result | What it may mean | Minimum next action |
|---|---|---|
| Outer “safe” zone | The selected historical model classifies the accounts above its upper cut-off. | Verify filing age, debt maturities, cash conversion and subsequent events; do not auto-approve. |
| Grey zone | The screen is inconclusive, even if the score has moved materially within the band. | Decompose the weighted contributions, compare at least three periods and test uncertain inputs. |
| Distress zone | The financial profile resembles the model’s distress population more closely. | Escalate for current liquidity evidence, covenant position, overdue liabilities and exposure controls. |
| Unavailable or unstable | Inputs are missing, inconsistent, outside the model’s scope or distorted by unusual denominators. | Do not invent values or force a classification; request the source evidence and document the limitation. |
For private companies with incomplete filings, missing data is itself a limitation. Do not set a missing value to zero merely to produce a result. Identify which component cannot be calculated, request the source document and state that the Z-Score is unavailable. The private-company financial statements guide explains how to locate and verify the underlying records.
The Altman Z-Score remains useful because it forces several parts of the accounts into one repeatable screen. Its best use is prioritisation: find the companies and periods that deserve deeper review. Its worst use is automation without context—especially when a buyer, lender or procurement team treats a historical zone as proof of current solvency.
Altman Z-Score FAQs
01What is the Altman Z-Score?
The Altman Z-Score is a weighted combination of accounting ratios developed to classify corporate financial distress. The original model uses working capital, retained earnings, EBIT, equity value, liabilities, sales and total assets. It is a screening signal, not a legal insolvency test, credit rating or guaranteed bankruptcy prediction.
02What does the Altman Z-Score measure?
It combines indicators of liquidity, cumulative profitability, operating performance, leverage and asset turnover into one score. A lower score generally indicates that the financial profile resembles the distress group used to develop that model more closely. It does not directly measure cash available on a payment date or the probability of default.
03How do you calculate the Altman Z-Score?
First choose the model that matches the company. For the original public-manufacturer model, calculate five ratios and apply the coefficients: 1.2 times working capital to total assets, 1.4 times retained earnings to total assets, 3.3 times EBIT to total assets, 0.6 times market value of equity to total liabilities, and 1.0 times sales to total assets. Then add the five contributions.
04What is the Altman Z-Score formula for a private company?
A commonly cited private-manufacturer variant is Z-prime = 0.717X1 + 0.847X2 + 3.107X3 + 0.420X4 + 0.998X5. X4 uses book value of equity divided by total liabilities rather than market value. Private non-manufacturers are often assessed with the four-variable Z-double-prime model instead. The model choice must be disclosed.
05What is a good Altman Z-Score?
There is no universal good score across all versions. In the original public-manufacturer model, values above 2.99 are traditionally called the safe zone, 1.81 to 2.99 the grey zone, and below 1.81 the distress zone. Other variants use different cut-offs. These labels are model classifications, not guarantees or investment recommendations.
06Can an Altman Z-Score be negative?
Yes. Negative working capital, accumulated losses, operating losses or negative book equity can make one or more components negative. A negative score is a strong reason to investigate the accounts and near-term liquidity, but it does not by itself establish that the company is legally insolvent or will fail.
07How do you interpret an Altman Z-Score in the grey zone?
Treat it as an inconclusive screening result. Recalculate the score across several years, verify the inputs and model, and review cash flow, debt maturities, covenant headroom, overdue liabilities, subsequent trading and sector conditions. A grey-zone score should trigger questions rather than a pass or fail decision.
08How accurate is the Altman Z-Score?
Accuracy depends on the model, population, period, industry, accounting quality and definition of failure. Historical performance figures from one study should not be transferred automatically to a different country or private-company population. Validate the model against the decision context and combine it with current evidence.
09Does the Altman Z-Score work for private companies?
It can be used as one screening tool if the appropriate private-company variant is selected and the required financial inputs are reliable. The original public-company model should not be used by simply substituting an arbitrary equity estimate. Private firms also publish less frequently, so filing age and subsequent events matter.
10Why does the Altman Z-Score not include cash flow?
The classical models were built from balance-sheet and income-statement ratios. Working capital captures part of the liquidity picture, but it does not show collections, capital expenditure, debt service or the timing of payments. Add operating cash flow, cash conversion, liquidity forecasts and debt-maturity analysis to a serious review.
11Is the Altman Z-Score suitable for banks and insurers?
Generally, no. Financial institutions have regulated capital structures, business models and balance sheets that differ fundamentally from industrial companies. Deposit funding, financial assets and regulatory capital require sector-specific analysis. A generic industrial-company Z-Score can create a misleading result.
12How can you calculate an Altman Z-Score in Excel?
Place the required financial inputs in labelled cells, calculate each ratio separately, multiply each ratio by the coefficient for the selected model, and sum the contributions. Keep the raw inputs, units, dates and formula version visible. Add error checks for zero or negative total assets, missing liabilities and mixed reporting periods.
Build the score from traceable evidence.
Research a company’s available financial statements in Veripoint. Confirm the entity, reporting period and exact inputs before relying on any distress classification.
Research a company